Jul 12, 2024: Apps and Websites - Caution!
A day or two ago an email from the Alpine Club indicated that numerous climbing incidents, of varying severity, have resulted from hiking route apps including technical routes. While this was specific to climbing there is no reason to believe that skiing and snow sport activities couldn't be subject to the same misleading information from various sources. There has also been no shortage of vehicle incidents resulting from Google maps and similar sources.
When it comes to on-the-snow routes for skiing, riding, etc, beware of accuracy on parameters such as slope angles. The last AIARE Level 2 fatal accident a few years ago occurred on a slope which the group had analyzed online or on a computer beforehand. Their slope angle estimate was off by a few degrees, which can make a difference. (We can't say in that case if that was a specific factor among others, but it's possible. And it could play a role in other locations and situations as well.) Other factors such as vegetation, alleged summer roads and trails, etc, may or may not be entirely accurate.
When it comes to on-the-snow routes for skiing, riding, etc, beware of accuracy on parameters such as slope angles. The last AIARE Level 2 fatal accident a few years ago occurred on a slope which the group had analyzed online or on a computer beforehand. Their slope angle estimate was off by a few degrees, which can make a difference. (We can't say in that case if that was a specific factor among others, but it's possible. And it could play a role in other locations and situations as well.) Other factors such as vegetation, alleged summer roads and trails, etc, may or may not be entirely accurate.
Feb 18, 2023: The 2022-23 Season as of February 14
Be sure to click on "read more" below the graph for the complete article/post.
Comments Disabled - Now that some time has passed and a few hundred spam comments have been deleted the comments are closed. If you would like to add anything, or make a guest post, contact us at snow@csac.org and we will make it happen.
It's time for a mid-season update on avalanche fatalities to date. In these updates we primarily focus on how the season compares to past seasons, going back ten years. At the end of the season a more comprehensive review can be prepared which looks at the reasons behind these incidents and what things, in general, could be done better or not overlooked. Our comprehensive review of last season is now available. Members can read a free online flipbook version or request a free Kindle version to be sent to their device. Non-members may purchase a print or Kindle version on Amazon.
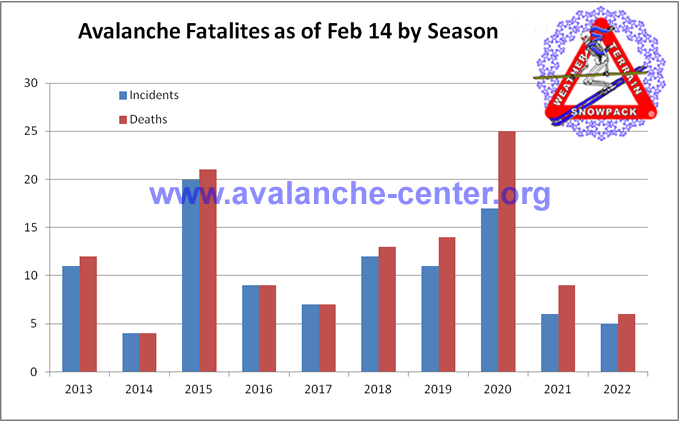
This season has been a good one so far, with the number of fatal avalanche incidents well below the ten year average. There have been 5 such incidents, with the average being 10.78. All of these have been in continental/transitional snowpack climates with 3 in Colorado.
The Role of Snowpack
This season was supposed to be the third La Nina in a row, which some reports claimed would make it less typical than other such years. Which turned out to be true. The previous two seasons had very thin snowpacks all season long, with avalanches breaking on buried layers often at or near the ground. Most of this year's fatalities occurred early in the season when this was still true, with the most recent being January 9 just as the situation was changing.
Comments Disabled - Now that some time has passed and a few hundred spam comments have been deleted the comments are closed. If you would like to add anything, or make a guest post, contact us at snow@csac.org and we will make it happen.
It's time for a mid-season update on avalanche fatalities to date. In these updates we primarily focus on how the season compares to past seasons, going back ten years. At the end of the season a more comprehensive review can be prepared which looks at the reasons behind these incidents and what things, in general, could be done better or not overlooked. Our comprehensive review of last season is now available. Members can read a free online flipbook version or request a free Kindle version to be sent to their device. Non-members may purchase a print or Kindle version on Amazon.
This season has been a good one so far, with the number of fatal avalanche incidents well below the ten year average. There have been 5 such incidents, with the average being 10.78. All of these have been in continental/transitional snowpack climates with 3 in Colorado.

The Role of Snowpack
This season was supposed to be the third La Nina in a row, which some reports claimed would make it less typical than other such years. Which turned out to be true. The previous two seasons had very thin snowpacks all season long, with avalanches breaking on buried layers often at or near the ground. Most of this year's fatalities occurred early in the season when this was still true, with the most recent being January 9 just as the situation was changing.
Feb 18, 2022: The 2021-22 Season as of February 18
Comments Disabled - Now that some time has passed and a few hundred spam comments have been deleted the comments are closed. If you would like to add anything, or make a guest post, contact us at snow@csac.org and we will make it happen your opinion/voice will be heard.
Be sure to click on "read more" below the graph for the complete article/post.
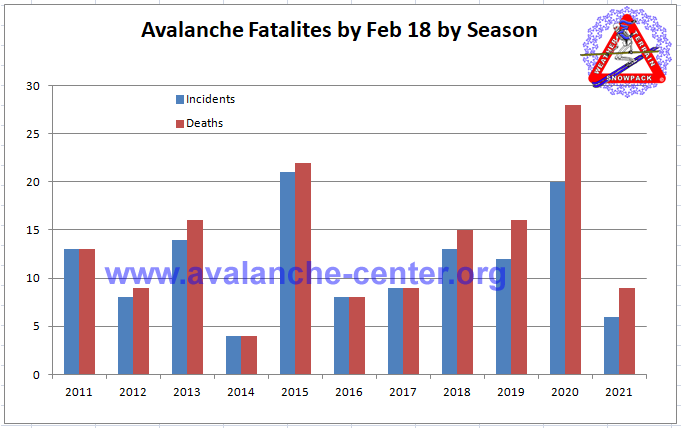
This season, up to this point, is a real contrast to last. Fatalities are well below the average for the past 10 seasons. There have been 6 fatal accidents with 9 deaths, while the average is 12 and 14. Three of those incidents had multiple fatalities, 2 in each case.
Full size graph, pop-up
Be sure to click on "read more" below the graph for the complete article/post.
This season, up to this point, is a real contrast to last. Fatalities are well below the average for the past 10 seasons. There have been 6 fatal accidents with 9 deaths, while the average is 12 and 14. Three of those incidents had multiple fatalities, 2 in each case.

Full size graph, pop-up
Apr 14, 2021: Is the Corona Virus Pandemic Causing Avalanche Deaths?
Jim Frankenfield, Avalanche-Center.org director
Comments Disabled - It is not a full season later and the spam bots have decided they like this post. If anyone does want to add a comment, or a guest post with a different point of view, please email us.
If you think this headline sounds crazy I have to agree with you. However, numerous articles in the mainstream media over the past 6 weeks or so have made such a claim. Let’s take a closer look at the reality.
The general argument is that the larger number of avalanche fatalities this season is a result of more people, especially newcomers, going into the backcountry. With the emphasis on newcomers the implication is that they lack the training necessary for their endeavors.
First we need to consider whether this season’s figures are really so far out of line with the last 10 years. Second we need to look at the victims and their experience. And finally we need to look at other factors which may offer a more reasonable explanation, such as the nature of the snowpack this season. We can also consider the experience in a couple other countries, including neighboring Canada.
Alternate opinions and theories are welcome, please feel free to comment. All comments are held for moderation but should be approved promptly, within a few minutes to 24 hours in most cases. Guest posts are also welcome, email snow@csac.org to arrange that.
Mar 06, 2021: Just how bad is this season?
Comments on this post are disabled because it is an old post and the spam bots have now discovered it. If you would like to comment or to arrange a related guest post contact the avalanche center at snow@csac.org
Be sure to click on "read more" below the graph for the complete article/post.
Numerous recent articles in the mainstream media paint a bleak picture of a catastrophic avalanche season in terms of fatalities. It is being blamed on the covid pandemic, like so many other things these days. This blog article will take a look at just how bad the current season really is, and why the number of fatalities alone may not be an honest indicator in the absence of a bit of a deeper look. The question of why the season is the way it is will be left, for the most part, for a follow up article.
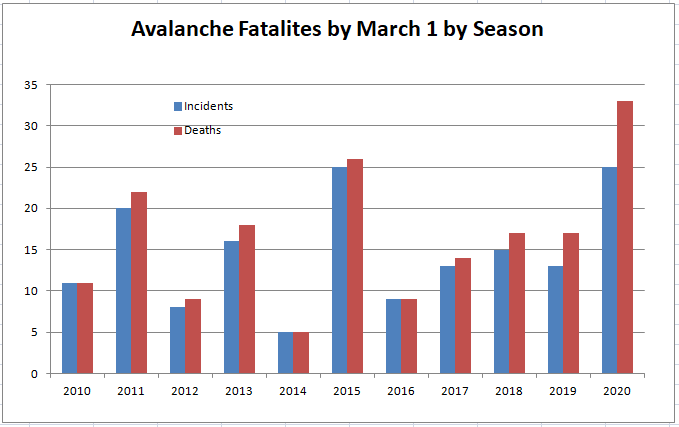
The number of fatalities as of March 1, in the US, is 33. Given that the average for the previous ten years is 14.8, and that the previous high during those years was 26, this does seem to be extremely tragic.
However, the number of fatal accidents as of March 1 is 25. While this is significantly higher than the ten year average of 13.5 there is a large amount of variation over those ten seasons. The previous March 1 high was also 25. So in terms of the number of incidents the 2020-21 season ranks at the top so far, but it is not above the previous high. A bad season for sure, but not as overboard as it’s being made out to be.
Full size graph, pop-up
Be sure to click on "read more" below the graph for the complete article/post.
Numerous recent articles in the mainstream media paint a bleak picture of a catastrophic avalanche season in terms of fatalities. It is being blamed on the covid pandemic, like so many other things these days. This blog article will take a look at just how bad the current season really is, and why the number of fatalities alone may not be an honest indicator in the absence of a bit of a deeper look. The question of why the season is the way it is will be left, for the most part, for a follow up article.
The number of fatalities as of March 1, in the US, is 33. Given that the average for the previous ten years is 14.8, and that the previous high during those years was 26, this does seem to be extremely tragic.
However, the number of fatal accidents as of March 1 is 25. While this is significantly higher than the ten year average of 13.5 there is a large amount of variation over those ten seasons. The previous March 1 high was also 25. So in terms of the number of incidents the 2020-21 season ranks at the top so far, but it is not above the previous high. A bad season for sure, but not as overboard as it’s being made out to be.

Full size graph, pop-up
Feb 05, 2021: Lessons from this Season (2020-21)
Note: As of Feb 18, 2022 commenting is disabled. This was posted some time ago now and recently the spam bots have discovered it. If you wish to comment on this or to arrange a related guest post contact us at snow@csac.org
Jim Frankenfield
Commenting is now working on our Nucleus blogs, after some php repair work. All comments are held for moderation automatically but should be approved promptly. So feel free to share any thoughts or observations.
There have been 6 fatal avalanche incidents so far this season. As I write this reports are coming in of a seventh with possibly 3 deaths but details are still emerging. (Followed by a few more now too.) The purpose here is to see what we can learn from the first six accidents taken together, about things to be conscientious about and things about this season. The post will not critique any particular incident in any detail.
Observations will be broken down into the categories most avalanche courses are based on: Safe Travel, Equipment and Rescue, Snowpack, Terrain, Weather, and decision making. Some of these categories are more instructive than others.
Reports for each incident are on avalanche-center.org for members, with official and media reports. The same information can be found elsewhere searching one.
1- A snowmobiler in Wyoming, Dec 18
2- A backcountry skier in Colorado, Dec 18
3- Two backcountry skiers in Colorado, Dec 19
4- A backcountry skier in Colorado, Dec 26
5- A side country snowboarder in Utah, Jan 8
6- A side country skier in Utah, Jan 30
Jan 15, 2021: Is this season any worse so far?
Comments Disabled - Now that some time has passed and a few hundred spam comments have been deleted the comments are closed. If you would like to add anything, or make a guest post, contact us at snow@csac.org and we will make it happen your opinion/voice will be heard.
While December got the season off to a rough start, especially in Colorado, the number of fatal accidents is neither worse nor better than the average over the past 10 year.
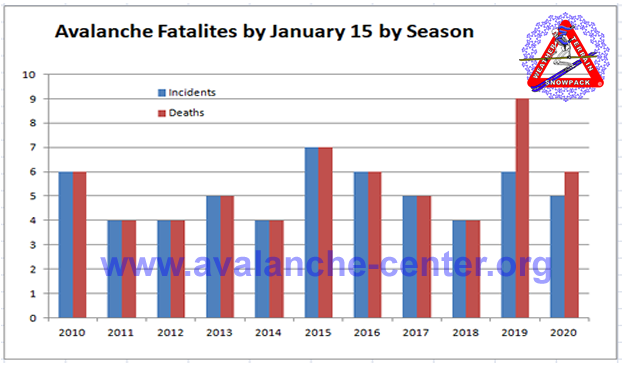
The number of fatal incidents is 5, vs. an average of 5.1. Four seasons were worse, four were better and 2 were they same. (The average is skewed just slightly higher by 7 incidents in the 2015-16 season.)
The number of fatalities is 6, which is just slightly higher than the average of 5.4. Most incidents involved one fatality so most years have the same number of incidents as deaths. This season one incident had 2 deaths. The average of the past 10 years is skewed up a bit from 5 based on last season (2019) which included an in-bounds ski area accident with 3 fatalities.
We can't really compare non-fatal accidents. Many are reported but we don't know how many are not. So this is based solely on the number of fatal incidents and fatalities, which are complete data sets.
The numbers typically increase a lot during the following month or so and we can't make any predictions about what will be yet. However, the season has not been more deadly than average so far as of January 15.
Full size graph, pop-up
While December got the season off to a rough start, especially in Colorado, the number of fatal accidents is neither worse nor better than the average over the past 10 year.
The number of fatal incidents is 5, vs. an average of 5.1. Four seasons were worse, four were better and 2 were they same. (The average is skewed just slightly higher by 7 incidents in the 2015-16 season.)
The number of fatalities is 6, which is just slightly higher than the average of 5.4. Most incidents involved one fatality so most years have the same number of incidents as deaths. This season one incident had 2 deaths. The average of the past 10 years is skewed up a bit from 5 based on last season (2019) which included an in-bounds ski area accident with 3 fatalities.
We can't really compare non-fatal accidents. Many are reported but we don't know how many are not. So this is based solely on the number of fatal incidents and fatalities, which are complete data sets.
The numbers typically increase a lot during the following month or so and we can't make any predictions about what will be yet. However, the season has not been more deadly than average so far as of January 15.

Full size graph, pop-up
Oct 31, 2011: US Avalanche Fatalities 2010-11: Quick Overview
Comments Disabled - Now that some time has passed and a few hundred spam comments have been deleted the comments are closed. If you would like to add anything, or make a guest post, contact us at snow@csac.org and we will make it happen your opinion/voice will be heard.
The 2010-2011 season ended on September 30 and we have a few overview graphs of fatalities for that season now. The total by our count is 24 individuals and 21 incidents. We are omitting an unwitnessed incident in Washington State which appears to have been a cornice fall that may have caused an avalanche below. The cause of the fatal incident does not appear to have been an avalanche. There are cases like this which are subjective, one year a climbing fall on Mt Hood resulted in a wet snow avalanche. Some counts included it, we considered it to be primarily a climbing fall.
The five year average in recent times has been 25-30 fatalities so this was a below average season.
Apr 02, 2011: March Incidents this Season
Comments on this post are disabled because it is an old post and the spam bots have now discovered it. If you would like to comment or to arrange a related guest post contact the avalanche center at snow@csac.org
After the previous entry about March ranking pretty high in fatalities how did this season stack up?
Well, first of all there have only been 14 fatal incidents which is well below average. (This does not count a cornice collapse in WA because it's not clear what role the avalanche played, if any, in the fatality. But this would make it 15.) The average over the previous 10 season is 31 or 32. And second, each of these had only one fatality. So in the US we've had fewer fatalities than usual and no multiple fatality incidents at all. A good winter so far!
Of the 14 fatal incidents 4 were March, or 29%. This makes March the month with the greatest number of fatal incidents and fatalities this season. Keep in mind, though, that the season total is bound to increase some which will lower the percentages shown.
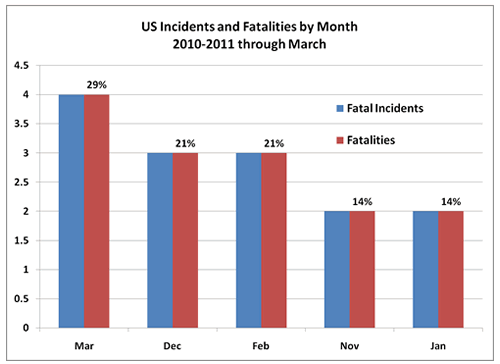
So how does this compare to a historical average? For all fatalities in the previous ten years March ranks fourth, after the preceding three months. Although it is very close to February and March and the difference between the three may be statistically insignificant. The percentage of fatalities is 19%. The number of incidents were not counted for this time period for this blog entry.
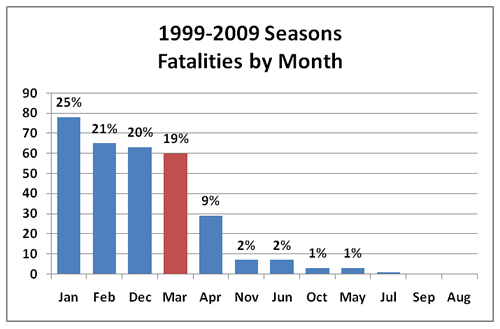
While this is interesting to review we can't draw too many conclusions from it. The sample sizes are clearly quite different (316 fatalities vs 14). The ten year graph does not distinguish between the different seasons, and there can be wide variations. This seasons graph does not reflect the entire season which will almost certainly increase the numbers, making the percentage for March lower. Although it's unlikely to lose it's top rank.
The distribution for the 1950-2009 seasons differs from that for the last ten. The last ten seasons are probably more representative of incidents today. Going back too far incorporates seasons when backcountry recreation was not as large a factor as it is today. Snowboards didn't exist and snowmobiles rarely got into avalanche terrain.
Looking ahead, there is a marked drop in April. This may not be true every season but on the whole there are less fatalities. Of course this may reflect the diminishing number of people in the backcountry as they transition to biking and boating as well as seasonal snowpack factors.
After the previous entry about March ranking pretty high in fatalities how did this season stack up?
Well, first of all there have only been 14 fatal incidents which is well below average. (This does not count a cornice collapse in WA because it's not clear what role the avalanche played, if any, in the fatality. But this would make it 15.) The average over the previous 10 season is 31 or 32. And second, each of these had only one fatality. So in the US we've had fewer fatalities than usual and no multiple fatality incidents at all. A good winter so far!
Of the 14 fatal incidents 4 were March, or 29%. This makes March the month with the greatest number of fatal incidents and fatalities this season. Keep in mind, though, that the season total is bound to increase some which will lower the percentages shown.

So how does this compare to a historical average? For all fatalities in the previous ten years March ranks fourth, after the preceding three months. Although it is very close to February and March and the difference between the three may be statistically insignificant. The percentage of fatalities is 19%. The number of incidents were not counted for this time period for this blog entry.

While this is interesting to review we can't draw too many conclusions from it. The sample sizes are clearly quite different (316 fatalities vs 14). The ten year graph does not distinguish between the different seasons, and there can be wide variations. This seasons graph does not reflect the entire season which will almost certainly increase the numbers, making the percentage for March lower. Although it's unlikely to lose it's top rank.
The distribution for the 1950-2009 seasons differs from that for the last ten. The last ten seasons are probably more representative of incidents today. Going back too far incorporates seasons when backcountry recreation was not as large a factor as it is today. Snowboards didn't exist and snowmobiles rarely got into avalanche terrain.
Looking ahead, there is a marked drop in April. This may not be true every season but on the whole there are less fatalities. Of course this may reflect the diminishing number of people in the backcountry as they transition to biking and boating as well as seasonal snowpack factors.
Mar 17, 2011: Spring Incidents, Lessons from Last Season
Comments on this post are disabled because it is an old post and the spam bots have now discovered it. If you would like to comment or to arrange a related guest post contact the avalanche center at snow@csac.org
As we begin to enter the spring season the snowpack tends to become more stable, or at least more predictable. But it can take a while to get there. And of course every year is different.
Early spring is always a transition period. Spring conditions are developing but winter weak layers are still active.
Combine these transitional snowpack conditions with longer days, and often with good weather, and the result can be more incidents. At least some years. Every year differs, and different locations have snowpacks that develop differently.
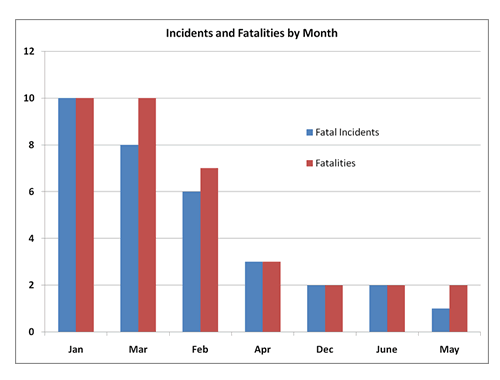
The bottom line, though, is to be careful during this period. As the following two graphs from last season show there can be a large number of accidents in the spring months in relation to the rest of the year.
The first chart is for the US. You can see that last year March was tied with January for the most fatalities in a month, leading even February. It was second in the number of accidents that included one or more fatalities. In April the numbers really dropped off. May and June generally see a few mountaineering accidents.
US 2009-10 Accidents by month:
The second chart is for Canada last season and the difference is even more pronounced.
Canadian 2009-10 Accidents by month:
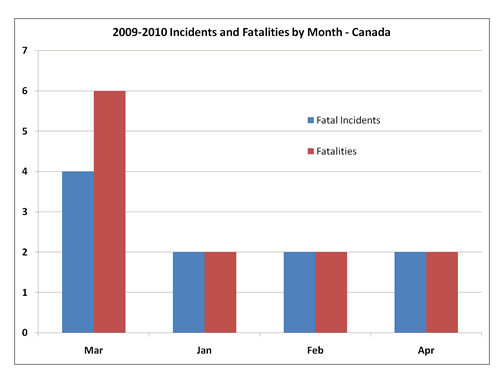
Remember that these graphs are just for the 2009-10 season, and that every year is different. The snowpack transition from a winter to a spring structure happens differently every year. It can be earlier or later, faster or slower.
A few years ago in many parts of western Canada the spring was cool and wet until very late, at which point rain suddenly fell up to high elevations. This rainfall on a wintery snowpack caused widespread wet snow avalanches and very dangerous conditions as late as May.
So remember that avalanche season is rarely over in March, in fact it may just be peaking in March or April some years.
As we begin to enter the spring season the snowpack tends to become more stable, or at least more predictable. But it can take a while to get there. And of course every year is different.
Early spring is always a transition period. Spring conditions are developing but winter weak layers are still active.
Combine these transitional snowpack conditions with longer days, and often with good weather, and the result can be more incidents. At least some years. Every year differs, and different locations have snowpacks that develop differently.
The bottom line, though, is to be careful during this period. As the following two graphs from last season show there can be a large number of accidents in the spring months in relation to the rest of the year.
The first chart is for the US. You can see that last year March was tied with January for the most fatalities in a month, leading even February. It was second in the number of accidents that included one or more fatalities. In April the numbers really dropped off. May and June generally see a few mountaineering accidents.
US 2009-10 Accidents by month:

The second chart is for Canada last season and the difference is even more pronounced.
Canadian 2009-10 Accidents by month:

Remember that these graphs are just for the 2009-10 season, and that every year is different. The snowpack transition from a winter to a spring structure happens differently every year. It can be earlier or later, faster or slower.
A few years ago in many parts of western Canada the spring was cool and wet until very late, at which point rain suddenly fell up to high elevations. This rainfall on a wintery snowpack caused widespread wet snow avalanches and very dangerous conditions as late as May.
So remember that avalanche season is rarely over in March, in fact it may just be peaking in March or April some years.

